
![]()
— FOR SUBSCRIBERS ONLY —
In this issue:
- Introduction
- Resource Opportunities editorial
- Tips for when to sell a company
- Company updates (TGM, KAM, AMM, MRO, CXB)
- Charts of interest
Bring out your dead, bring out your dead…
By Tommy Humphreys
Happy Halloween everyone… What a week to be a junior resource investor. Gold broke support and the miners’ charts are collapsing, especially those exposed to Burkina Faso, where a military coup has taken place. The industry is approaching a true capitulation moment, with two newsletter writers we know bailing on the sector entirely in the past week. Note: these are guys who do what the charts tell them. Cough cough…
Personally I am not selling anything. In fact, I actually added to a few names (KAM, TGM, PGM, CNL, MRO) in a small way, mindful to keep some cash for the coming wipeout. We are going to see great deals trading at pennies a share shortly as tax-loss selling season runs its course here in Canada.
On the other hand, we only lose money if we accept the price the market is willing to pay us. I refuse to, and this helps me cope with current staggering paper losses.
The good news is the faster we get this meltdown over with, the sooner we can begin to make some money again. On a call yesterday with a successful resource investor, I was reminded that the true wealth creators in this sector are not traders, they are long term backers of exploration teams they know intimately. They also get into these deals at a great price.
A market like this may create the next Lukas Lundin, Ross Beaty or John Tognetti.
Is there any liquidity left?
Fully invested? Terrified? It’s tough to be too optimistic about the resource sector when the typical funds and investors are tapped out, and have been for some time. There is no more liquidity to average down in many cases. This is why it’s paramount that a junior mining company promoter have access to investors outside of Vancouver or Toronto. There is a market for the resource message and it’s likely among those who have enjoyed 2000+ days of a S&P 500 bull market, and weren’t burned in juniors three years ago.
We are still getting the hang of the newsletter, so in this issue we will start with an editorial from Lawrence, including some advice from him on knowing when to sell deadbeat juniors.
Then we will update some of our top companies: True Gold Mining, Kaminak Gold, Millrock Resources, Almaden Minerals, and Calibre Mining.
Finally, we comment on 14 charts of interest.
If you have any questions about a particular company, email us and we will respond.
Thanks for being with us.
Tommy Humphreys in Vancouver, Canada
November 1, 2014 – 7:41AM PST
Resource Opportunities Editorial
By Lawrence Roulston
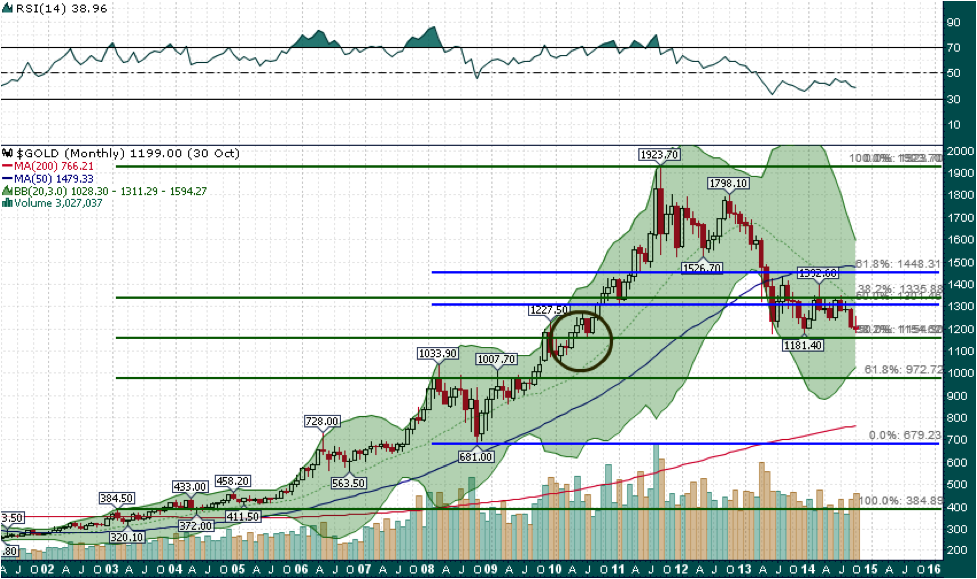
The gold price is trapped between the downward pressure of paper selling and the support of physical buying. Exchange Traded Fund (ETF) holdings are at the lowest level since 2009 as investors (mostly Western-based) continue to exit the market. Physical buyers, most notably in the two largest markets – India and China – continue to take up every ounce of gold that comes out of the ETF vaults.
News that the Fed is about to eliminate the easy money that has fueled investment markets saw the gold price, along with most other asset classes, declining in price.
The range-bound up and down action in the gold market is likely to continue for some time yet, propelled up or down by the headline of the moment. Over time, the gold price will certainly increase, as the $3.5 trillion of new Fed liabilities weighs on the currency values.
Former Fed Chairman Alan Greenspan, at the recent New Orleans Investment Conference, noted that gold would be “measurably” higher in five years. That is not the sort of strong statement that gold bulls have grown used to. Nevertheless, it is bold in the context of someone who states that he would never make a market prediction.
The other metals are also due for a medium term bounce. Silver, which roughly tracks gold over time, is now trading far below the normal range. The gold to silver ratio is now at 71. Silver investors can expect a recovery in silver along with gold, with the added impetus of returning to a more normal 60 to one ratio.
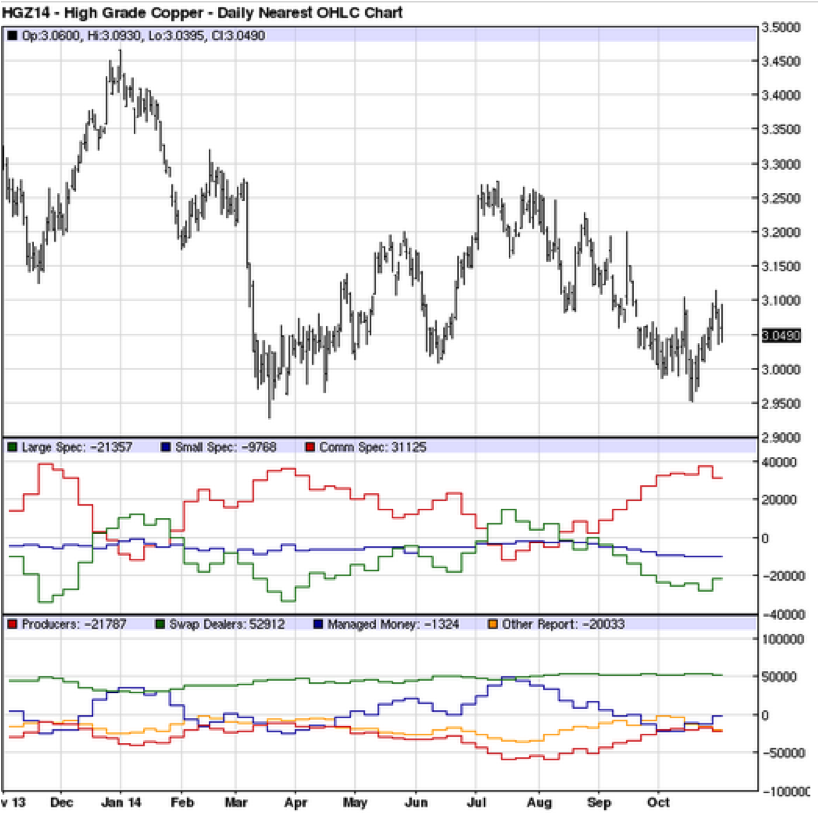
The copper price, in mid-month, fell under $3.00, reflecting the general lack of investor interest in base metals. However, the copper price recovered sharply when it was revealed that somewhere between 80% and 90% of London Metal Exchange stocks were held by a single owner. A hedge fund, led by an expert copper trader, has been quietly accumulating metal for most of the year.
That one-way trade in the red metal would appear to be soundly based, as production is falling short of expectations, with further supply disruptions likely. Investors are reacting to a potential squeeze in the market, and are also taking note of the actions of someone who really understands the market.
Another bit of anecdotal evidence that the recovery in the mining industry is gaining momentum is that attendance at recent mining-oriented investment conferences has been surprisingly strong. Some investors clearly recognize that the current bargain prices may not be available much longer.
The investors who are now buying mining stocks understand the cyclical nature of the mining industry. They know that demand for metals is continuing to rise and that there are serious constraints on the ability of the mining industry to expand production net of on-going mine closures due to depleted reserves.
Those same investors are also wise enough to differentiate between companies that represent genuine value versus the majority of companies in the industry. Many junior mining companies are still substantially overvalued in terms of tangible asset value.
Many of us hold shares purchased at much higher share prices. It is often difficult to dump shares that are so far underwater. Yet, many of those companies will never recover, and in fact still have considerable downside risk. This issue includes an article intended to help investors rationalize their portfolios.
Is there any hope for these stocks?
Some tips to help determine when it is time to dump a company.
By Lawrence Roulston
Unfortunately for many investors, most of the junior resource companies are trading at prices well below their highs. Sadly, the vast majority of those companies will never achieve their high prices again.
Before discussing how to determine if there is any hope for recovery (or even survival) let us look at how we got into this mess. From 2009 to 2011, investors injected tens of billions of dollars of new money into junior mining companies. A large portion of that money went into exploration companies. Most of the explorers did their level best to make a discovery. Few succeeded, as it is a game of long odds. Big new mineral discoveries are rare.
Falling metal prices added to the negative sentiment and also pushed up the hurdle rate for what might become an economic deposit. Even well-established deposits in many cases were made uneconomic by the falling metal prices.
With the exploration budgets spent, and the balance of the cash used up in travel, administration, salaries and rent, a lot of companies are now left with no assets and no cash. The value of a company like that is pretty close to zero.
Investors dumped the failed explorers, pushing share prices down to pennies or even fractions of pennies. With the majority of companies in the sector declining in value, investors began to sell everything, forcing prices down across the board.
The good companies, along with the bad, saw their share prices pushed down. Many of the high quality companies are now trading at bargain prices. The question is, how do you tell the difference? We will get to that in a moment.
Many of these companies have office leases, a management team that relies on salaries, and the need to pay auditors and listing fees. For many companies, a new financing is the only way to survive.
Some analysts have predicted that a lot of companies will lose their listings. Some will, but not as many as expected. The reason is that the Toronto Stock Exchange and the Venture Exchange are owned by a profit oriented, publicly traded company. A high proportion of their revenue comes from the fees from the listed companies. The Exchange will do everything they can to help companies remain listed.
Some investors might think that a share price of half a cent is as low as it can get. Not so. You see, the minimum financing price is five cents. To even qualify to raise new money, those companies must consolidate their shares (or do a “rollback” or a “reverse split”).
An informal survey that we did earlier this year showed that the total market value of a company soon after a consolidation is about 40% less than before the rollback. In other words: A company with a one cent stock, after consolidating 10:1, will likely trade at around six cents. In many cases, the shares continue to decline over the following months to the pre-consolidation price level.
Investors must look at each company individually to determine if there is any value, or a hope that there might one day be value. The best source of company information is the company website. Another extremely important site is sedar.com. That site hosts the publicly available information for all Canadian-listed companies.
The first thing to look at is who is running the company. A strong management group, with reputations to protect, and some “skin in the game” will try a lot harder than others to revive a near-death company. To determine insider holdings a useful site is sedi.ca. Look at their track records to see if they have had success in the past. Look carefully at whether they have 20 years of experience, versus one year of experience repeated 20 times.
Some of those companies with no assets become “shells” that are used for new ventures. It’s hard to know ahead of time if a particular shell will attract a deal and a management team. Even then, the incoming people will likely want to load up with cheap paper, so rollbacks are common for shells.
Money is critical. Look at the latest financial statements. Look at both cash and working capital (current assets minus current liabilities). Also, watch out for other liabilities. Debt, including accounts payable, for a company with no earnings can be fatal.
It is also important to determine how much cash was consumed in the latest quarter and to project that “burn rate” forward, reducing the cash level from the latest reported cash balance. It is important to remember that the numbers you are looking at are somewhere between two and five months out of date.
There are some companies with little or no cash, but with very low burn rates and with joint venture partners funding exploration. Those companies have a chance of adding shareholder value.
Then, look at the projects. At this time, most exploration-stage projects will attract little shareholder value. In some cases, companies are trading at less than the value of cash in the bank, on the recognition that their exploration projects will consume cash with the odds against a discovery.
There are a lot of metal deposits around that made sense at $1900 gold or $30 silver, but have little value in the current market.
Another very important item to determine is holding costs. Even for staked ground, there is an obligation to spend a minimum annual amount. Often, the companies have earn-in requirements that can far exceed their ability to raise cash.
Read the Management Discussion and Analysis (MDA) carefully. Take the forward looking statements with a grain of salt. They may plan to conduct a drilling program to delineate a resource. If they don’t have cash, they won’t be drilling.
If you are not certain, it is a good idea to call the company. Don’t just hear the spiel. Engage them in dialog and look for detailed answers to specific questions.
The important point in doing this exercise is to determine the best use of your money. If the share price is down, you have already lost money. At this time, the only question is whether your money has a better chance of appreciating in the company you hold, versus something else that you might buy instead.
There is a lot of money circling around the junior resource industry – tens of billions of dollars. Investors at this time are very discriminating and quietly picking away or waiting for the right moment to get in. For the most part, the investors coming in want cash flow, now or in the near future. There are some tremendous opportunities at this time to invest in high quality companies, with big upside potential.
As a basic rule of thumb, if you conduct your due diligence in a company you own and in conclusion you wouldn’t add to that position now that it’s trading at depressed prices, sell the whole thing.
Company updates
True Gold Mining (TGM.TSXV)
Shares in True Gold fell to a multi-year low this week after the president of Burkina Faso was deposed and parliament set on fire, despite impressive progress at the company’s fully funded and permitted Karma project.
True Gold said operations at Karma have been uninterrupted by the conflict, and all of its employees are accounted for and safe. Despite this, the company’s shares fell from $0.30 to start the week to a low of $0.14 Friday, finally closing at $0.20.
The week previous, True Gold reported a robust PEA on the North Kao deposit, in close proximity to the Karma mine. North Kao will have a significant impact on the Karma project with projected free cash flow of ~$118 million. The economics are robust due to high grades, low capital costs, and synergies realized by sharing infrastructure with the Karma mine. The IRR on the project is 213% (after-tax) with a payback period of only 5 months. It is hard to find numbers close to this anywhere in the mining industry today.
The Karma mine is in construction and is fully funded thanks to a streaming agreement deal cut with Franco Nevada and Sandstorm Gold. Production is expected to commence in Q4 2015 with 160,000 ounces projected for 2016 at an all in cash cost of $720 per ounce.
Management, led by Mark O’Dea, have a proven track record with experience of building/operating 11 mines worldwide.
True Gold offers investors one of the very few projects worldwide that is permitted, funded and in construction.
The civil situation adds an element or risk to the company, which is offset by the large upside potential of a very attractive project that should see a re-rating as it enters production, and the current low share price.
Price: $0.20
Shares Outstanding: 398.4 M
Shares Fully Diluted: 482.9 M
Market Cap: $79.8 M
Contact Investor Relations
(phone # 604-801-5020)
www.truegoldmining.com
Almaden (Minerals AMM.TSX)
Almaden Minerals is spinning out their exploration assets and royalties into a new company. The Ixtaca gold/silver project will remain in Almaden with all other assets being transferred to the new spin company. Each current shareholder will receive .60 of a share in the new Spin co for each Almaden share held. We view this as a positive move that could unlock value for current shareholders. The spin out is expected to close before the end of 2014.
The purpose of the spin out is to focus the company on the Ixtaca project. Located in Puebla State, Mexico, the Ixtaca deposit is a potential takeover candidate with a 43-101 resource of ~4.3 million ounces of gold equivalent in all categories. A recently updated PEA shows an after tax IRR of 28% and a 2.5 year payback period using $1320 gold and $21 silver.
Almaden has everything that a major would want in a takeover candidate: a large scale, advanced project, with lower capex, solid economics and a mining friendly jurisdiction. The Ixtaca project will continue to move forward with on-going drilling, a PFS in 2015, and a EIS filing in 2015.
As of September, the company has a solid balance sheet, with roughly $13 million in cash, 1597 ounces of gold bullion, and ~$4.9 million in equity investments. Almaden also owns 5 drill rigs which helps keep exploration costs among the lowest in the industry.
The father and son management team of Duane and Morgan Poliquin are also among the best in the business. We view the current share price an attractive entry point.
Price: $1.29
Shares Outstanding: 68.73 M
Shares Fully Diluted: 81.54 M
Market Cap: $88.7 M
Contact Investor Relations
(phone # 1-604-689-7644)
www.almadenmining.com
Kaminak Gold (KAM.TSXV)
With $23 million in the bank, Kaminak Gold has almost enough cash to complete a Feasibility study, expected by the end of 2015. The permitting process will likely take 24 months after that, CEO Eira Thomas said by phone. The Coffee project should be shovel ready by the end of 2017.
Kaminak has received a lot of attention since highly successful resource investors Lukas Lundin and Ross Beaty invested $13.5 million this Summer after a site visit up to the Coffee project. The long term investors saw first hand a simple project with district potential in a safe jurisdiction, Thomas said.
The company has received significant media coverage since the Lundin/Beaty investment, however not a lot of interest in the stock, down 25% since the July 2014 financing. Thomas believes her company is on all the right investor watch lists, and when the appetite for junior mining stocks returns, Kaminak will be among the earliest and strongest beneficiaries.
Three drills remain turning on site at Coffee. The company expects to be able to find additional heap leachable oxide gold ounces which would add further value to this already highly attractive project.
Ultimately, we see Kaminak as a takeover candidate for a mid-tier gold producer. The current price reflects a compelling entry point, but investors should take their time accumulating junior mining stocks in this environment, as things could always get cheaper before the final blow off. However, we see more potential for near term gains than downside risk from the current price level.
Price: $0.61
Shares Outstanding: 122.79M
Shares Fully Diluted: 150.2 M
Market Cap: $74.9 M
Contact Investor Relations
(phone # 1-844-646-4520)
www.kaminak.com
Millrock Resources (MRO.TSXV)
Prospect generator Millrock Resources has undergone a restructuring and raised significant capital from strong shareholders (including Haywood Chairman John Tognetti and Casey Capital Strategies).
The company raised $4 million in an oversubscribed private placement at $0.05 then consolidated its shares 10-for-1, reducing outstanding shares to 19.7 million (32.6 million fully-diluted). Some of these investors are locked-up for two years.
Millrock is an Alaskan-based prospect generator with a portfolio of active projects across Alaska, Arizona, Mexico and New Mexico. They are technically-focused and led by CEO Gregory Beischer and Chief Exploration Officer Philip St. George who was part of team that discovered the huge Pebble deposit.
Partner companies include First Quantum and Teck Resources.
The company’s stated goal for 2015 is to have a drill-rig turning throughout the entire year which should provide steady news flow.
Millrock is now well positioned to execute its long term business plan of finding joint venture partners and making discoveries, and has brought on board some highly successful financial backers. Additionally, they should be able to use the current depressed resource markets to pick up other prospective properties. For these reasons, we look to accumulate a position in Millrock in the open market during the next two months of tax loss selling.
Price: $0.37
Shares Outstanding: 19.7 M
Shares Fully Diluted: 32.6 M
Market Cap: $7.2 M
Net Cash: $4.8 M
Contact Investor Relations
(phone # 604-638-8164)
www.millrockresources.com
Calibre Mining (CXB.TSXV)
Calibre Mining is a prospect generator with 3 joint venture partners current funding exploration projects in Nicaragua. Two of the company’s joint venture partners are gold producers B2Gold and Iamgold who are both currently drilling projects to earn in. Calibre is also currently trenching and mapping at the 100% owned Montes project.
The Minnesota project showed strong trench results this month with 93.5m of 1.95 g/t gold. Positive early exploration results have proven up a 3 kilometer anomaly. B2Gold and Calibre are eager to see what the drill bit turns up and have commenced a 10-12 hole (1500m) drill program. B2Gold owns 51% of this project and is the operator. An additional 19% interest can be earned if B2Gold elects to spend an additional $6 million in the next 3 years.
Iamgold has extended the drill program at the Eastern Borosi project from 31 to 45 holes. This is a positive sign and assays have been received from the first 18 holes. So far the drilling has tested three vein systems and the additional drilling will allow for more testing along the 4km strike length.
Pierre Lassonde owns a 11.2% stake after putting in $2 million in a September financing. Management are also well aligned with shareholders owning 9% of the company.
Calibre is an excellent exploration stock and the recent dip in share price represents an attractive entry point. JV partners are currently funding a combined 58 drill holes on two separate projects with no cost to Calibre. Over the next 3 years Calibre expects to have $12 milion dollars of work funded by partners on its projects.
Price: $0.115
Shares Outstanding 222.91M
Shares Fully Diluted: 248.86 M
Market Cap: $25.6 M
Working Capital: ~$3 million
Contact Investor Relations
(phone # 604-681-9944)
www.calibremining.com
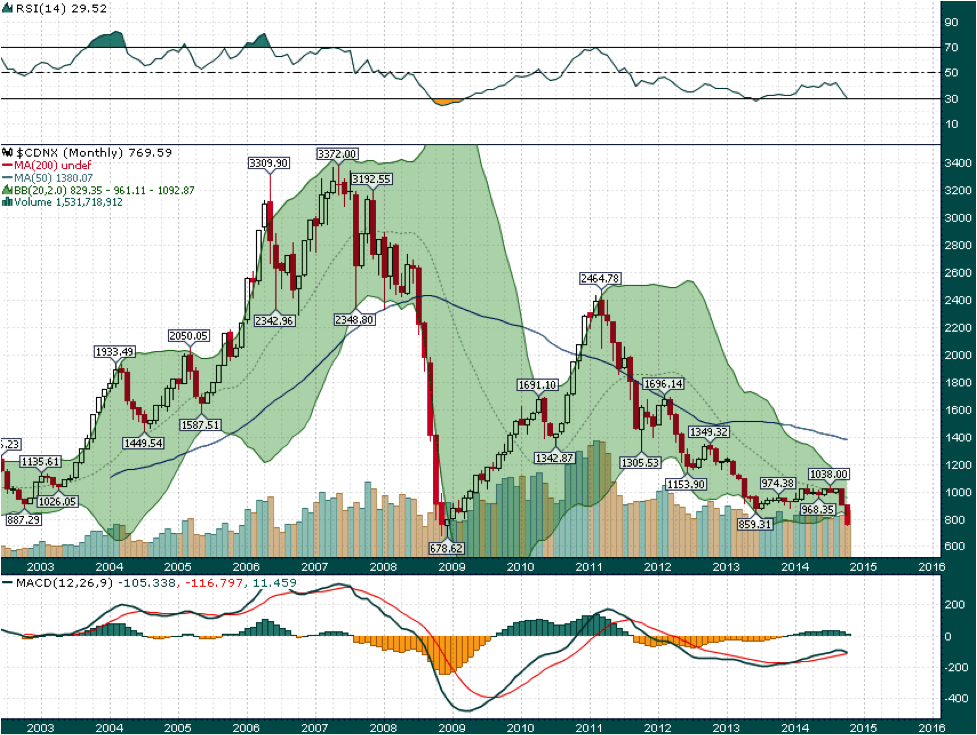
Charts of interest
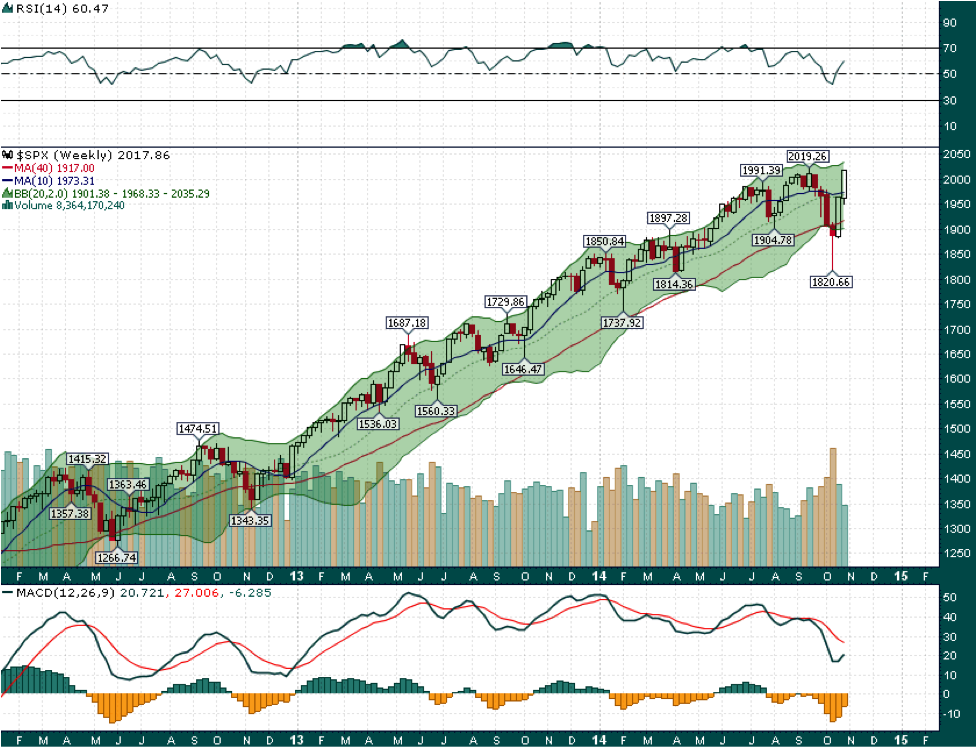
Last week in global markets we saw incredible strength in equities along with a complete capitulation in the metals and mining space. The market is sending a clear message that inflation will continue to be not too hot and not too cold while global growth will eventually pick up. Whether or not this turns out to be the case is up for debate, however, for the time being the market is convinced that such a scenario is exactly how things will unfold.
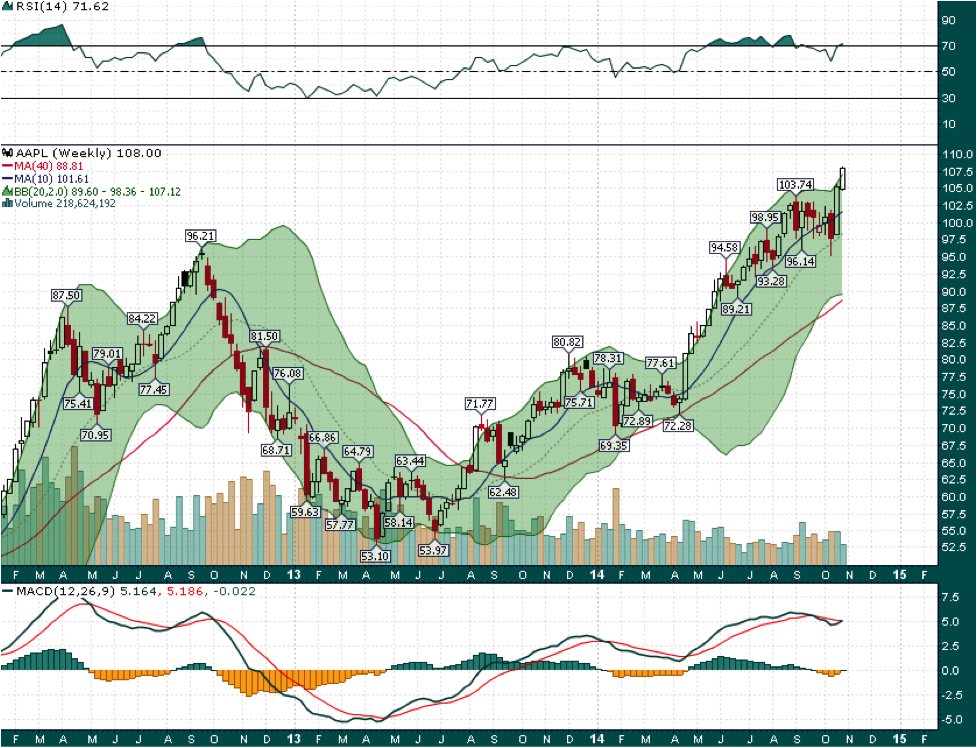
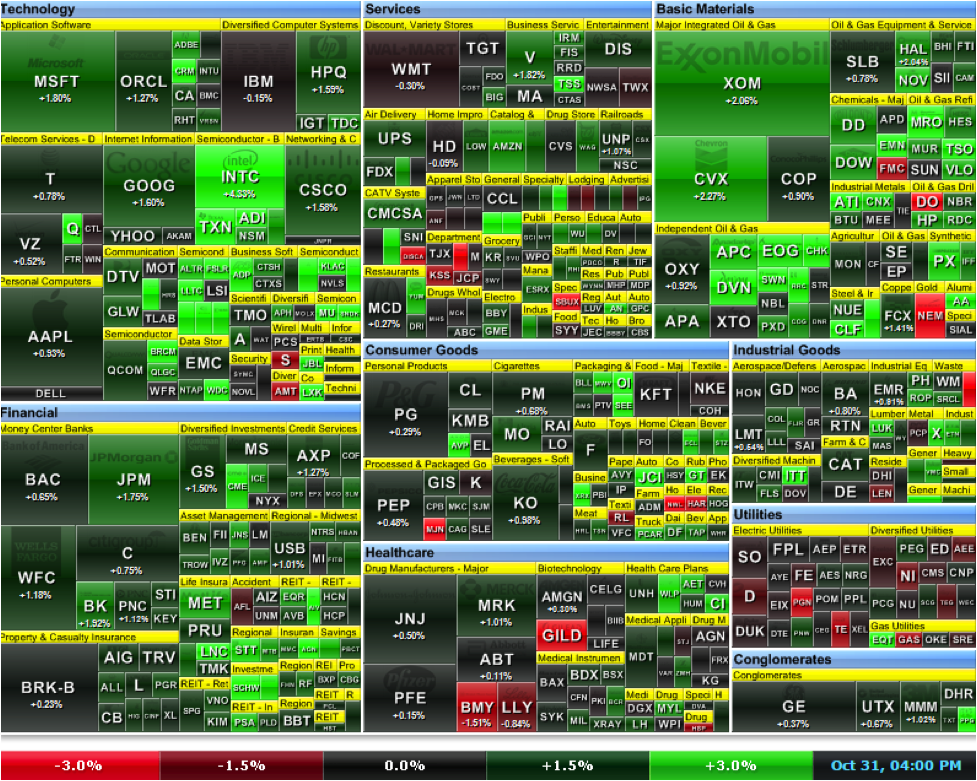
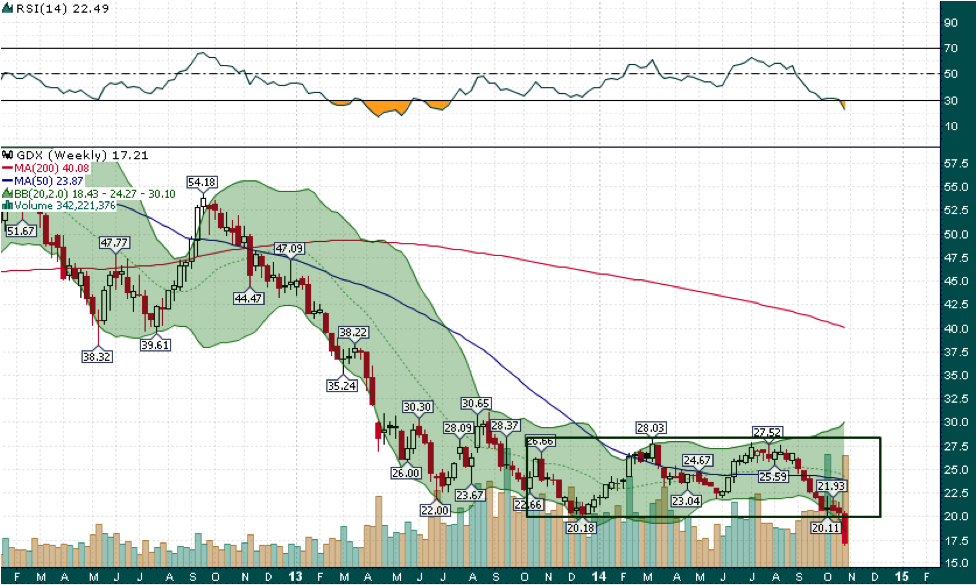
I have selected 14 charts which offer a thorough overview of trends across various markets & asset classes:
SPX
AAPL
Heatmap
GDX
TSX-V
Gold weekly

Gold monthly
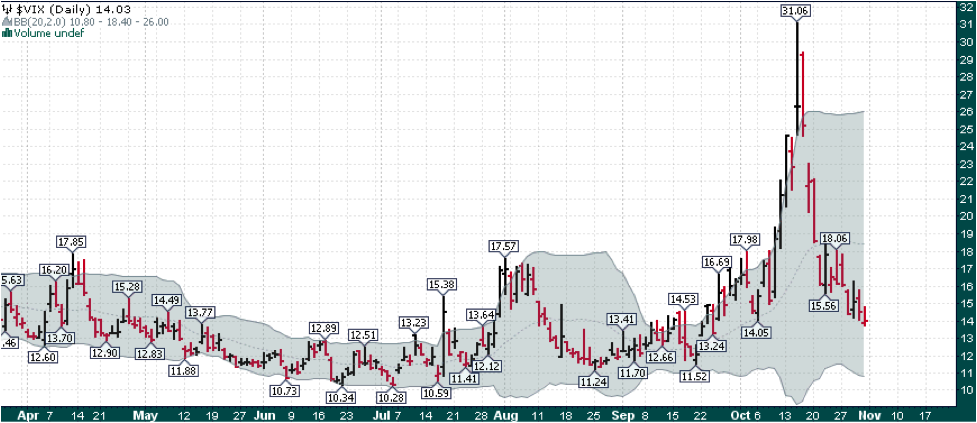
VIX
Copper
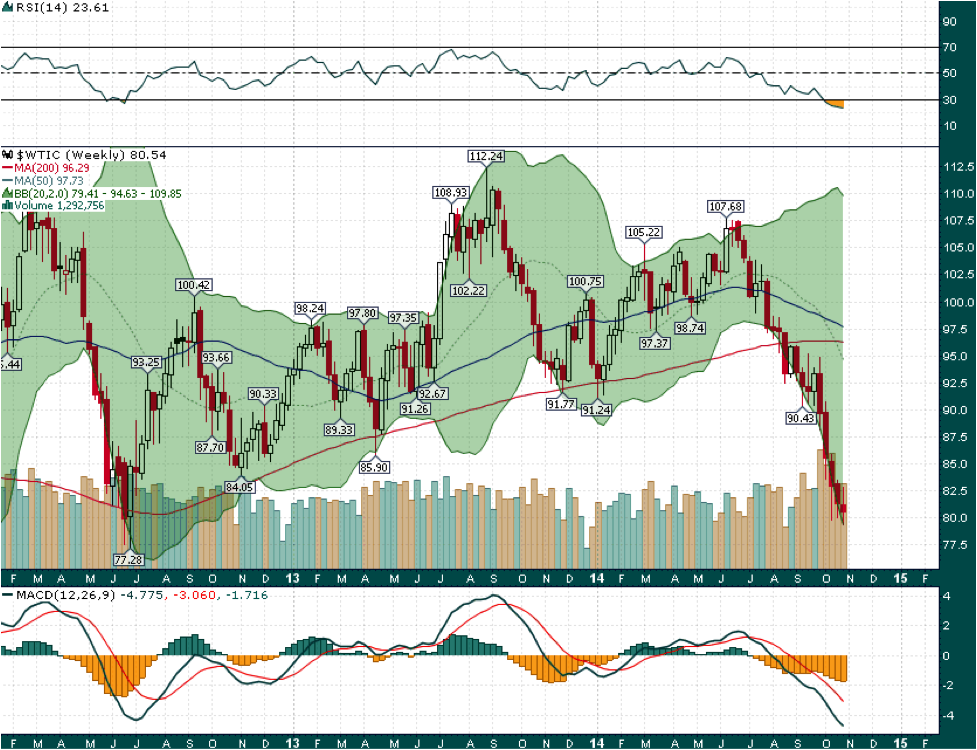
WTIC
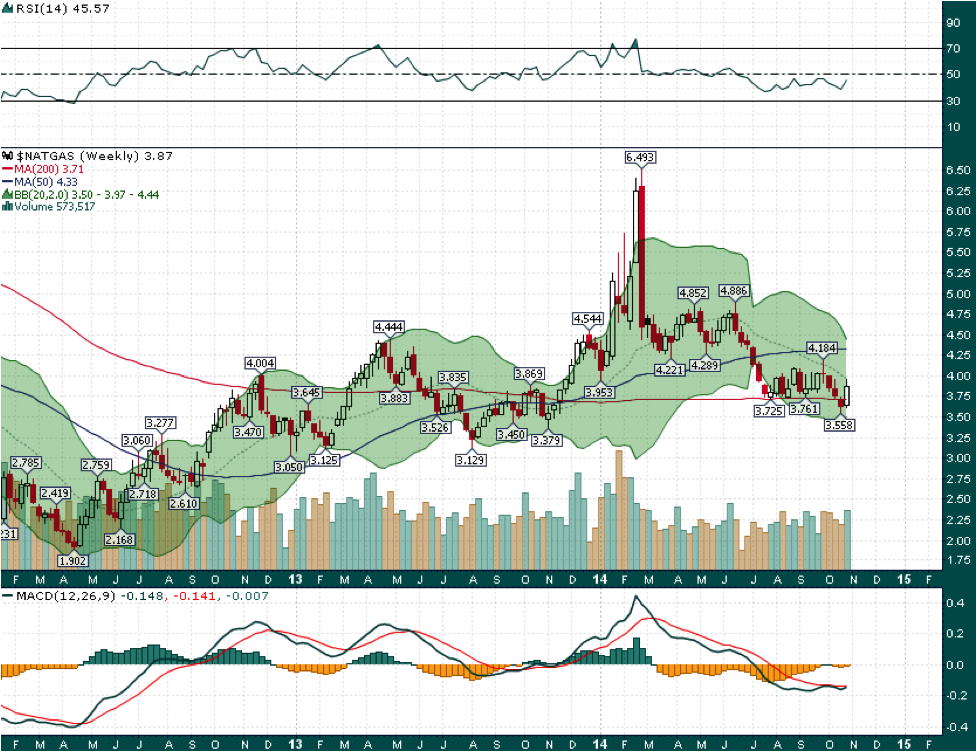
NATGAS
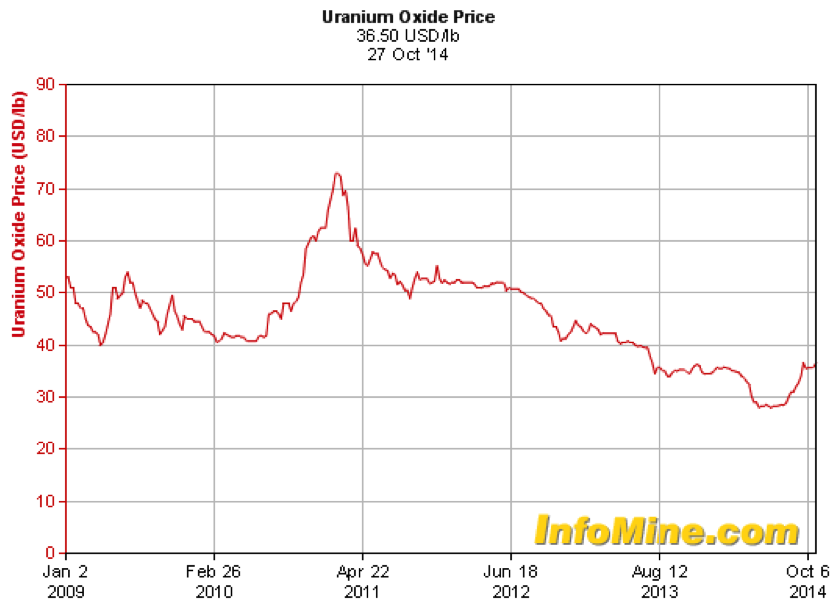
Uranium
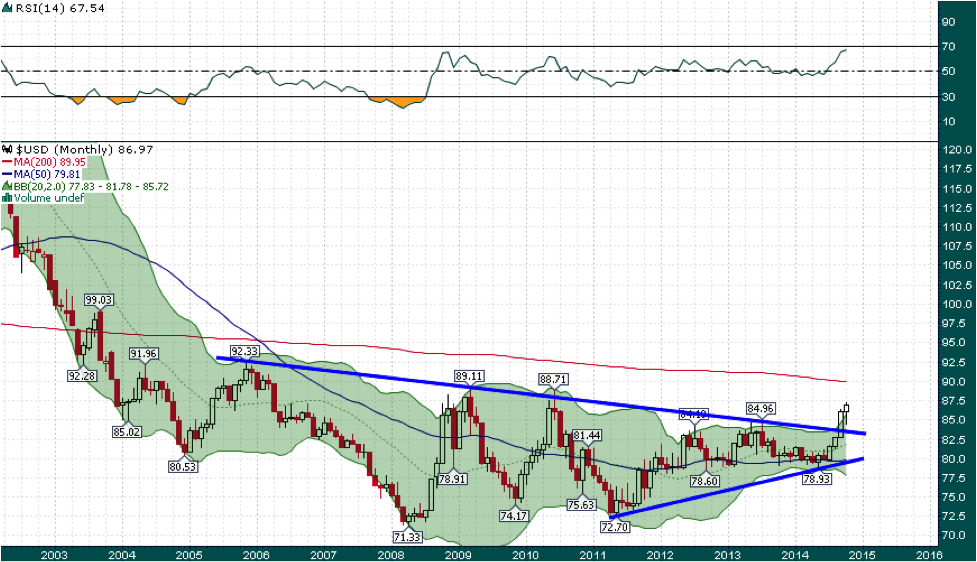
USD
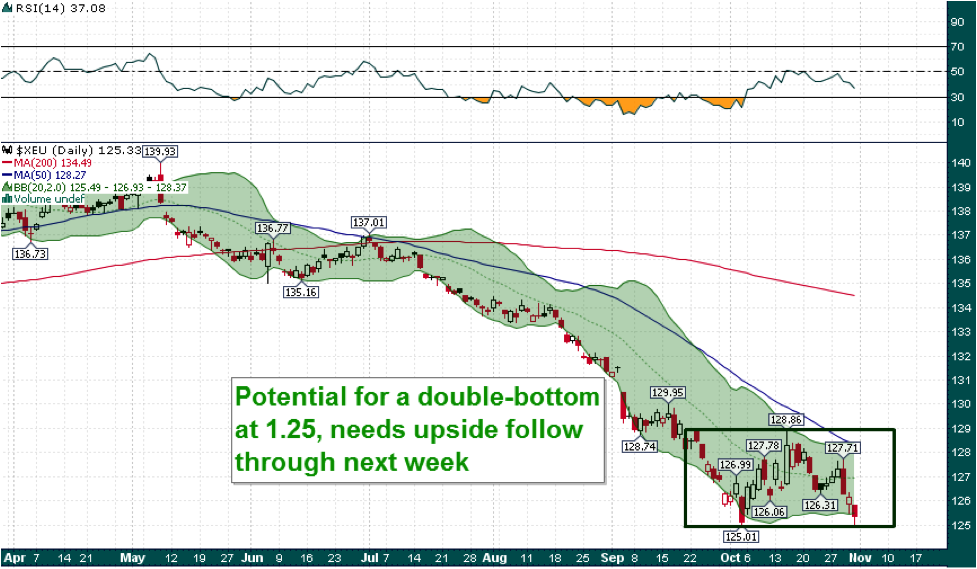
EUR/USD
Editorial Policy, Disclaimer and Disclosure: Resource Opportunities is written, edited and published by Tommy Humphreys, 602-1228 Homer St., Vancouver, BC, V6B 2Y5. Tel: (604) 697-0026 www.ResourceOpportunities.com
Editorial Policy: Companies are selected for presentation in this publication strictly on the merits of the company. No fee is charged to the company for inclusion. Currencies: Dollar and $ refer to US dollars, unless stated otherwise or obvious from the context (for example, a share price on a Canadian exchange). Readers are advised that the material contained herein is solely for information purposes. Readers are encouraged to conduct their own research and due diligence, and/or obtain professional advice. Nothing contained herein constitutes a representation by the publisher, nor a solicitation for the purchase or sale of securities. The information contained herein is based on sources which the publisher believes to be reliable, but is not guaranteed to be accurate, and does not purport to be a complete statement or summary of the available data. Any opinions expressed are subject to change without notice. The owner, editor, writer and publisher and their associates are not responsible for errors or omissions. They may from time to time have a position in the securities of the companies mentioned herein, and may change their positions without notice. (Any significant positions will be disclosed explicitly.) Author is not a registered investment advisor and this is not a formal investment recommendation. We are not telling you to go buy or sell this stock. We are telling you that we bought this stock and that we highly recommend that you research the stock to see if it is a good fit in a well-diversified portfolio. We recommend that you do as much research as possible on every stock you purchase or sell prior to any action. We recommend that you consult your investment advisor or broker prior to any action. We are not liable for any transactions you make after reading this article. Do your own due diligence prior to making any investment decision. Additionally, we invest with a 12 month or longer time horizon. If your time horizon is shorter, you may consider other investments.
Copyright: This publication may not be reproduced in whole or in part, in any form, without the express permission of the publisher. Permission is given to extract parts of the report for inclusion or review in other publications only if credit is given, including the name and address of the publisher.
 James Kwantes is the editor of Resource Opportunities, a subscriber supported junior mining investment publication. Mr. Kwantes has two decades of journalism experience and was the mining reporter at the Vancouver Sun. Twitter:
  Resource Opportunities (R.O.) is an investment newsletter founded by geologist Lawrence Roulston in 1998. The publication focuses on identifying early stage mining and energy companies with the potential for outsized returns, and the R.O. team has identified over 30 companies that went on to increase in value by at least 500%. Professional investors, corporate managers, brokers and retail investors subscribe to R.O. and receive a minimum of 20 issues per year. Twitter: